First Published: 2021-01-15
Americas Headquarters
Cisco Systems, Inc.
170 West Tasman Drive
San Jose, CA 95134-1706
USA
http://www.cisco.com
Tel: 408 526-4000
800 553-NETS (6387)
Fax: 408 527-0883
THE SPECIFICATIONS AND INFORMATION REGARDING THE PRODUCTS IN THIS MANUAL ARE SUBJECT TO CHANGE WITHOUT NOTICE. ALL STATEMENTS, INFORMATION, AND RECOMMENDATIONS IN THIS MANUAL ARE BELIEVED TO BE ACCURATE BUT ARE PRESENTED WITHOUT WARRANTY OF ANY KIND, EXPRESS OR IMPLIED. USERS MUST TAKE FULL RESPONSIBILITY FOR THEIR APPLICATION OF ANY PRODUCTS.
THE SOFTWARE LICENSE AND LIMITED WARRANTY FOR THE ACCOMPANYING PRODUCT ARE SET FORTH IN THE INFORMATION PACKET THAT SHIPPED WITH THE PRODUCT AND ARE INCORPORATED HEREIN BY THIS REFERENCE. IF YOU ARE UNABLE TO LOCATE THE SOFTWARE LICENSE OR LIMITED WARRANTY, CONTACT YOUR CISCO REPRESENTATIVE FOR A COPY.
The Cisco implementation of TCP header compression is an adaptation of a program developed by the University of California, Berkeley (UCB) as part of UCB’s public domain version of the UNIX operating system. All rights reserved. Copyright © 1981, Regents of the University of California.
NOTWITHSTANDING ANY OTHER WARRANTY HEREIN, ALL DOCUMENT FILES AND SOFTWARE OF THESE SUPPLIERS ARE PROVIDED “AS IS" WITH ALL FAULTS. CISCO AND THE ABOVE-NAMED SUPPLIERS DISCLAIM ALL WARRANTIES, EXPRESSED OR IMPLIED, INCLUDING, WITHOUT LIMITATION, THOSE OF MERCHANTABILITY, FITNESS FOR A PARTICULAR PURPOSE AND NONINFRINGEMENT OR ARISING FROM A COURSE OF DEALING, USAGE, OR TRADE PRACTICE.
IN NO EVENT SHALL CISCO OR ITS SUPPLIERS BE LIABLE FOR ANY INDIRECT, SPECIAL, CONSEQUENTIAL, OR INCIDENTAL DAMAGES, INCLUDING, WITHOUT LIMITATION, LOST PROFITS OR LOSS OR DAMAGE TO DATA ARISING OUT OF THE USE OR INABILITY TO USE THIS MANUAL, EVEN IF CISCO OR ITS SUPPLIERS HAVE BEEN ADVISED OF THE POSSIBILITY OF SUCH DAMAGES.
Any Internet Protocol (IP) addresses and phone numbers used in this document are not intended to be actual addresses and phone numbers. Any examples, command display output, network topology diagrams, and other figures included in the document are shown for illustrative purposes only. Any use of actual IP addresses or phone numbers in illustrative content is unintentional and coincidental.
Cisco and the Cisco logo are trademarks or registered trademarks of Cisco and/or its affiliates in the U.S. and other countries. To view a list of Cisco trademarks, go to this URL: http://www.cisco.com/go/trademarks. Third-party trademarks mentioned are the property of their respective owners. The use of the word partner does not imply a partnership relationship between Cisco and any other company. (1721R)
© 2017—2021 Cisco Systems, Inc. All rights reserved.
New and Changed Information
The following table provides an overview of the significant changes up to the current release. This table does not provide an exhaustive list of all the changes or of the new features up to this release.
| Feature | Description | Release |
|---|---|---|
Cisco SID Analysis |
The following features were introduced:
The following feature was removed:
|
2.0(1) |
Cisco SID Collector |
The following features were introduced:
|
2.0(1) |
Cisco SAN Insights Discovery Overview
Overview
Cisco SAN Insights Discovery (SID) provides information about SAN health by analyzing Cisco MDS and Brocade Fibre Channel switches in your fabric. Cisco SID analyzes information such as ports, VSANs, zones, licenses, and so on, and provides information about fabrics and switches. You can use this information not only to analyze the health of your fabrics and troubleshoot issues but also to migrate to new Cisco fabric deployments.
Cisco SID uses the following features to provide information about SAN health:
-
Cisco SID Collector: Uses a Secure Shell (SSH) session to connect to the seed switch in your fabric to generate a collection zip file for the fabric. This collection zip file provides a snapshot of the SAN health of your fabric at the time it was generated. Hence, you can generate multiple collection zip files over a period of time as per your requirement.
The seed switch must be connected to all the switches in your fabric for the switch to collect the SAN health of the fabric. Also, ensure that all the switches in your fabric can be accessed via SSH and use the same SSH credentials. -
Cisco SID Analysis: Displays SAN health information of your fabrics and switches using the collection zip file that was generated using Cisco SID Collector. You can upload multiple collection zip files on Cisco SID Analysis. You can also view and share multiple reports as per your requirement.
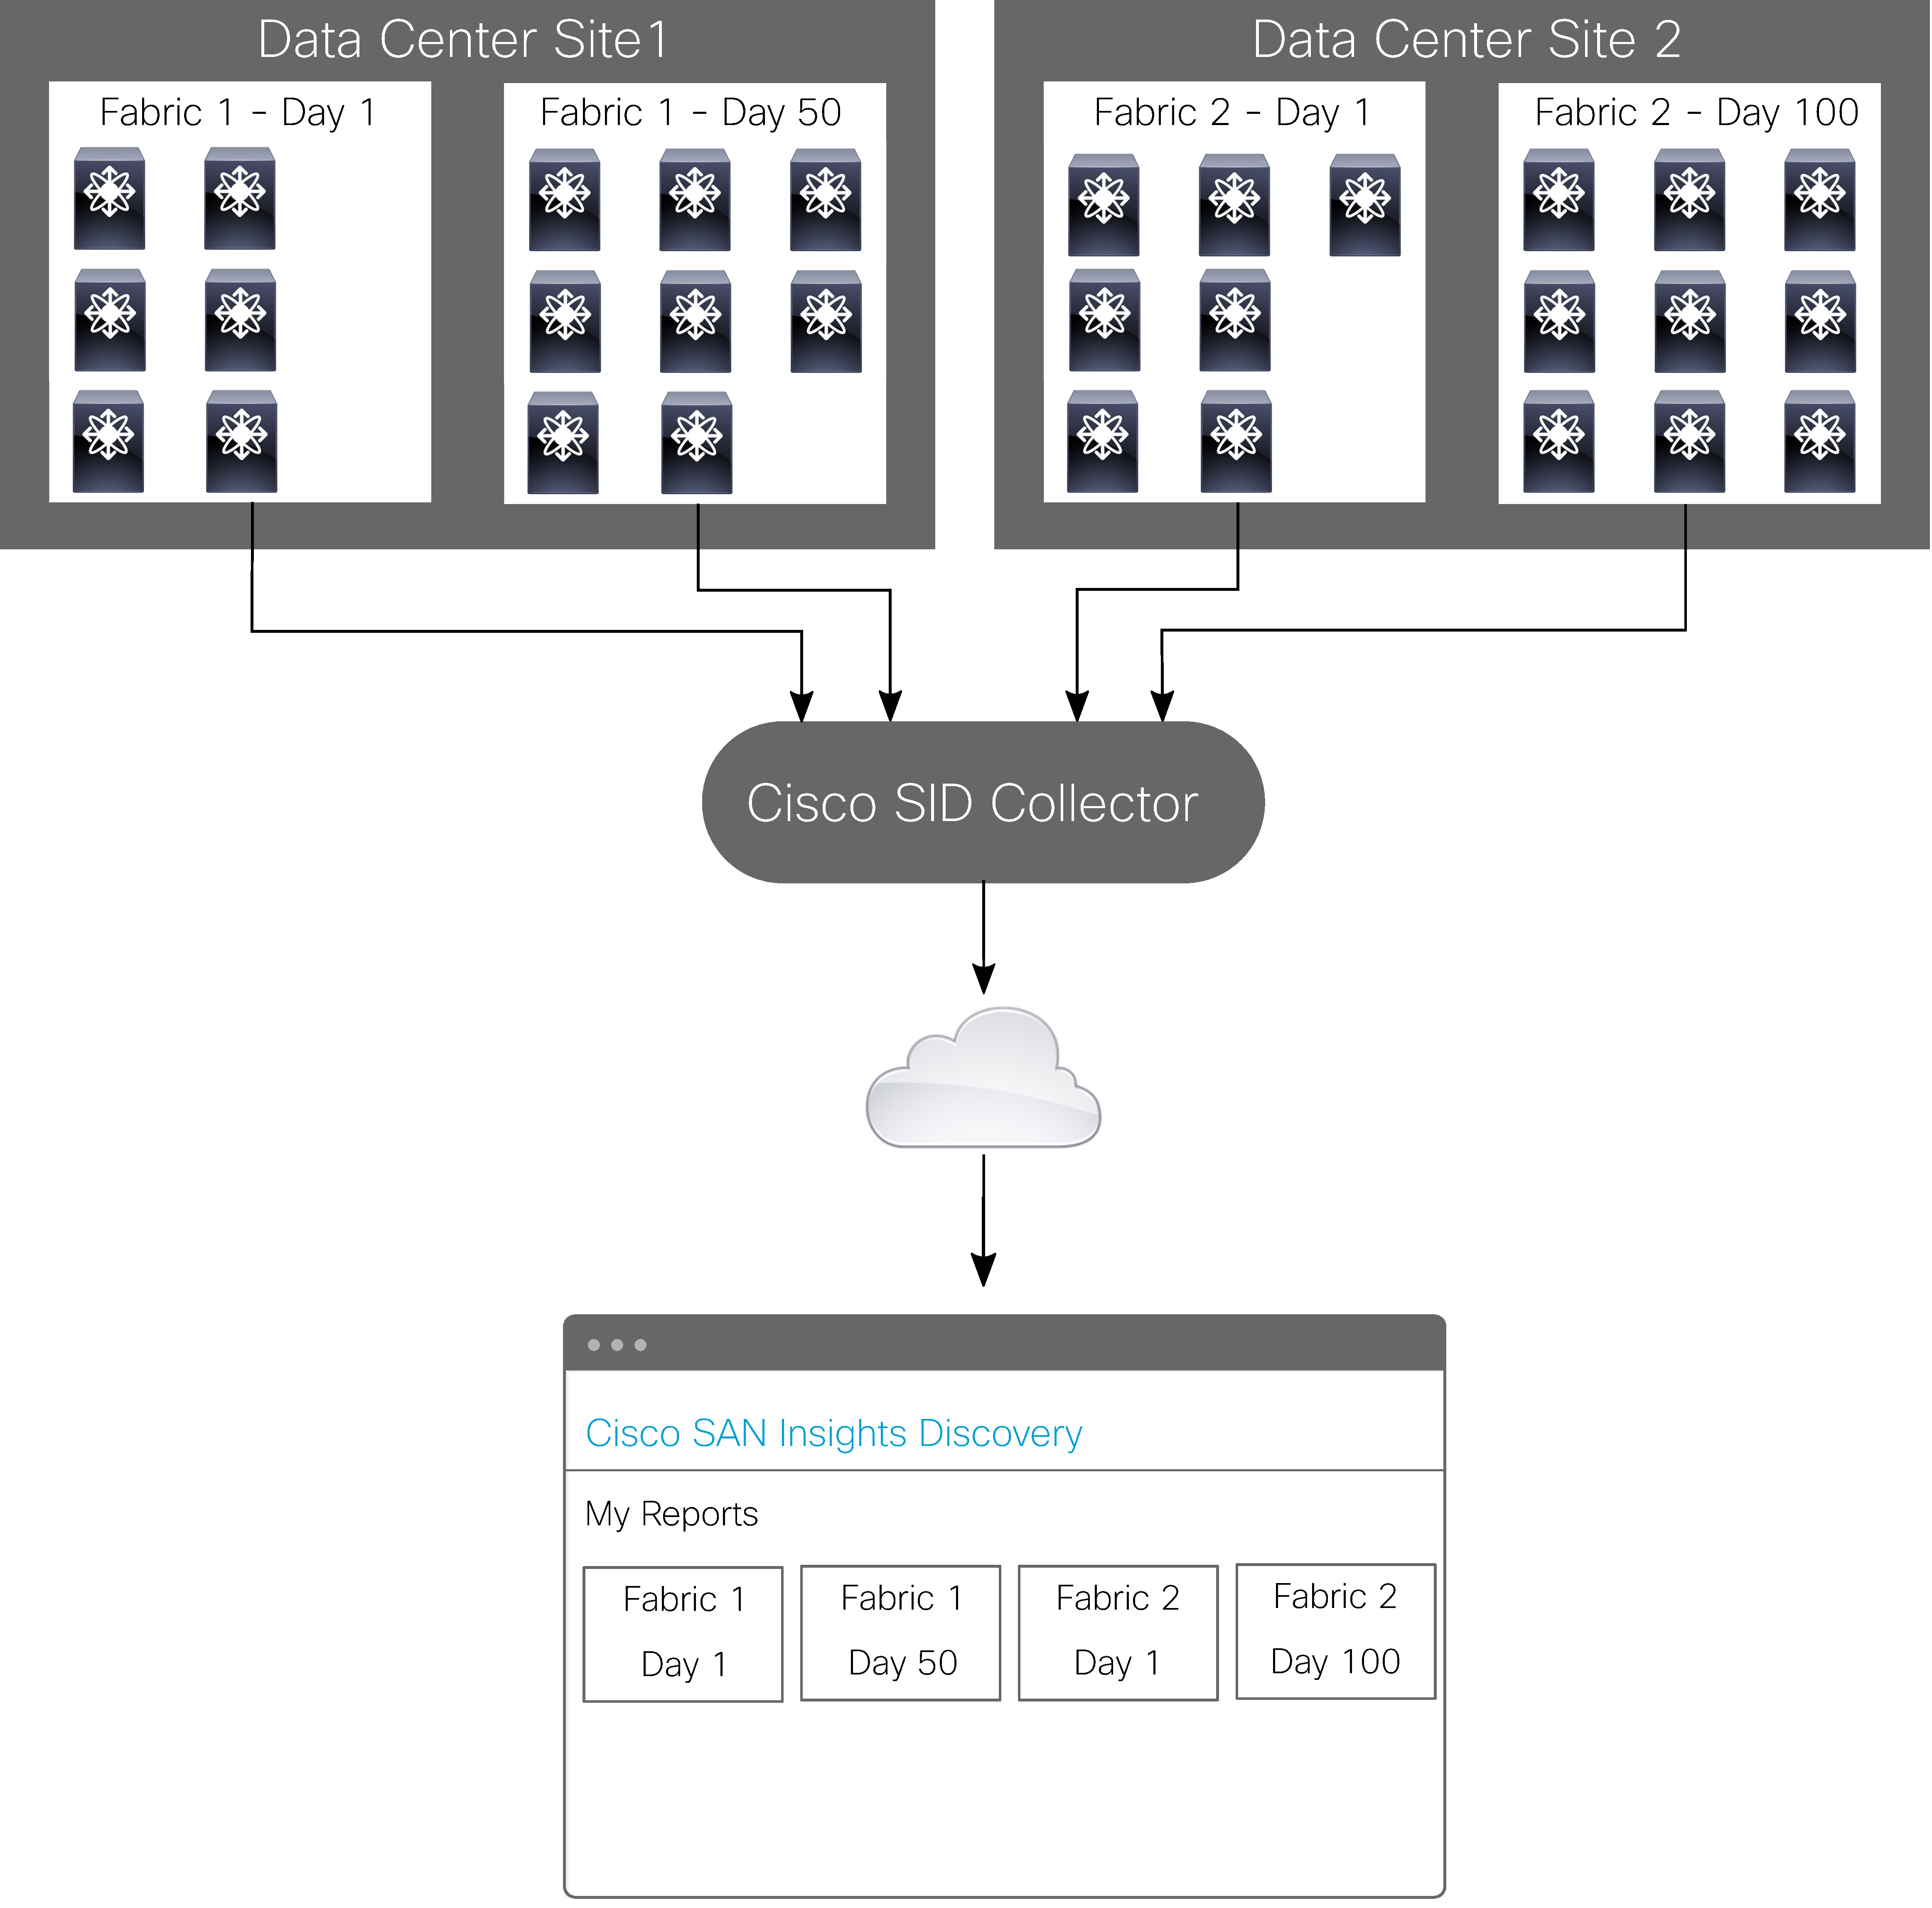
Cisco SID Overview displays how Cisco SID works. In this sample topology, we have two fabrics and each fabric is configured on a separate data center site. Cisco SID Collector is used to generate collection zip files over a period of time and these zip files are analyzed using Cisco SID Analysis.
System Requirements
The following are required for installing and using Cisco SID:
-
Windows 10, Windows Server 2016, Windows Server 2019, Red Hat Enterprise Linux 7.9, or Red Hat Enterprise Linux 8.2
-
Latest version of Google Chrome
Installing Cisco SID Collector
Prerequisites
-
Ensure that the you have configured the same credentials for all the switches in your fabric.
-
Ensure that all the switches in your fabric can be accessed via SSH and use the same SSH credentials.
Installing Cisco SID Collector on Windows
Use this procedure to install Cisco SID Collector on Windows.
Procedure
-
Go to https://software.cisco.com.
-
Log in to your Cisco.com account.
-
Under the Download & Upgrade section, click Software Download.
-
In the Select a Product search field, search for SAN Insights Discovery.
-
Download the application.
-
Extract the contents of the zip file to a folder.
-
Run collect-server.exe.
For information on using the Cisco SID Collector, see Using Cisco SID Collector on Windows.
Installing Cisco SID Collector on Linux
Use this procedure to install Cisco SID Collector on Linux.
Procedure
-
Go to https://software.cisco.com.
-
Log in to your Cisco.com account.
-
Under the Download & Upgrade section, click Software Download.
-
In the Select a Product search field, search for SAN Insights Discovery.
-
Download the application.
-
Extract the contents of the zip file to a folder.
For information on using the Cisco SID Collector, see Using Cisco SID Collector on Linux.
Using Cisco SID Collector on Windows
Use this procedure to understand how to use Cisco SID Collector on Windows.
Before you Begin
Ensure that you have installed the latest version of Cisco SID Collector. For installing Cisco SID Collector see, Installing Cisco SID Collector on Windows.
Procedure
-
Open the Cisco SID Collector application on your computer.
-
On the welcome screen of the application, click Start.
-
In the Fabric Name field, enter an appropriate fabric name.
The maximum length of a Fabric Name is 30 characters and must not include spaces. The allowed characters are uppercase letters (A to Z), lowercase letters (a to z), numbers (0 to 9), and special characters such as underscore (_), period (.), and dash (-). -
In the Seed Switch field, enter the IP address of the seed switch.
-
(Optional) In the IP’s to Skip field, enter the IPv4 address of the devices to be skipped from discovering. You can enter multiple IP addresses separated by comma, range of IP address limited to the last octets, or a combination of these options; however, wildcard is not supported.
If switches or end devices are connected to the switch whose IP address is to be skipped, the collector will skip collecting information for the switches and end devices too. -
In the Seed Switch Credentials fields, enter the SSH username of the seed switch in the Username field and the SSH password of the seed switch in the Password field.
The Username and Password are the CLI username and password of the seed switch. The Password must be at least 8 characters in length. -
(Optional) Check the Collect Performance Data for 1 hour option to collect the Rx and Tx counter information for every port that is up and operational. If you enable this option and after the fabric is discovered, the collector will run for an hour collecting the Rx and Tx information for every 5 minutes. The final Rx and Tx information will be an average of all the Rx and Tx counter information. When this option is not enabled, the Rx and Tx counter information will be a one time Rx and Tx counter information for the Rx and Tx utilization.
To collect the Rx and Tx information, the collector uses the show interface counters brief or show interface command for Cisco switches and the portperfshow -tx -rx -t 0 command for Brocade switches. For older Brocade switches that do not support this command, the collector will not be able to collect the Rx and Tx information. -
Click Submit.
Ensure that all the required fields are updated. Otherwise, the Submit option will be disabled. The application starts to collect the required information and displays the information being collected on the screen. The application displays the Success! message after the process is complete.
-
(Optional) Click More Details to view logs.
For Brocade switches that are operating in the Access Gateway mode, click the More Details option to verify that there are no errors in collecting the switch information. If there are errors, you need to create a text file with the filename Brocade_Switch_IP_List.txt and add WWN to switch IP address mapping in the format Brocade switch wwn,Brocade switch IP address. Ensure that you add an additional line at the end; otherwise, this information is not captured. Place this file in the same folder where the collector executable files are located and then run this file through the collector for this information to be captured in the report. Example of a sample Brocade_Switch_IP_List.txt file:
# Brocade AG switches # [wwn],[IP] xx:xx:xx:xx:xx:xx:xx:xx,1.1.1.2 # EOF -
Click Restart to run another report, or click Exit to exit the application.
For Cisco MDS switches, alerts collected using the show module internal exceptionlog command are for the last 6 months. For Brocade switches, alerts collected using the errdump command are for the last 15 days. For information on alerts, see Alerts Dashboard.
Using Cisco SID Collector on Linux
Use this procedure to understand how to use Cisco SID Collector on Linux.
Before you Begin
Ensure that you have installed the latest version of Cisco SID Collector for Linux. For installing Cisco SID Collector on Linux see, Installing Cisco SID Collector on Linux.
Procedure
-
Navigate to the folder where you have downloaded the Cisco SID Collector application.
-
Open a terminal from the same folder location.
-
Run the ./sid-collector_linux.bin -fabricname=name -ip=ip-address -user=username -password=password -polling=interval -output=folder-name -skipip=ip-address command.
Table 2. Syntax Description -fabricname=name
Specifies the fabric name. The maximum length of a Fabric Name is 30 characters and must not include spaces. The allowed characters are uppercase letters (A to Z), lowercase letters (a to z), numbers (0 to 9), and special characters such as underscore (_), period (.), and dash (-).
-ip=ip-address
Specifies the IPv4 address of the seed switch.
-user=username
Specifies the SSH username of the seed switch.
-password=password
Specifies the SSH password of the seed switch. The password must be at least 8 characters in length.
-polling=interval
(Optional) Specifies to collect the Rx and Tx counter information for every port that is up and operational. Enter True to enable or False to disable the polling interval. The default value is False.
If you enable this option and after the fabric is discovered, the collector will run for an hour collecting the Rx and Tx information for every 5 minutes. The final Rx and Tx information will be an average of all the Rx and Tx counter information. When this option is not enabled, the Rx and Tx counter information will be a one time Rx and Tx counter information for the Rx and Tx utilization.
To collect the Rx and Tx information, the collector uses the show interface counters brief or show interface command for Cisco switches and the portperfshow -tx -rx -t 0 command for Brocade switches. For older Brocade switches that do not support this command, the collector will not be able to collect the Rx and Tx information.
-output=folder-name
Specifies the folder name where the collected zip file is saved on the computer. The folder name can be a relative or absolute path.
-skipip=ip-address
(Optional) Species the IP address of the devices to be skipped from discovering. You can enter a range of IP address by specifying the first IP address and specifying the last octet of the IP address separated by a hyphen. For example, 209.165.201.2-5.
If switches or end devices are connected to the switch whose IP address is to be skipped, then the collector will skip collecting information from the switches and end devices too.
| If there are Brocade switches that are operating in Access Gateway mode and If there are errors in the report, you will need to create a text file with the filename Brocade_Switch_IP_List.txt and add WWN to switch IP address mapping in the format Brocade switch wwn,Brocade switch IP address. Ensure that you add an additional line at the end; otherwise, this information is not captured. Place this file in the same folder where the collector application file is located and then run this file through the collector for this information to be captured in the report. |
Example of a sample Brocade_Switch_IP_List.txt file:
# Brocade AG switches
# [wwn],[IP]

xx:xx:xx:xx:xx:xx:xx:xx,1.1.1.2
# EOF| For Cisco MDS switches, alerts that are collected using the show module internal exceptionlog command are for the last 6 months. For Brocade switches, alerts that are collected using the errdump command are for the last 15 days. For information on alerts, see Alerts Dashboard. |
Cisco SAN Insights Discovery Analysis GUI Overview
Setting Up Your Accounts
You need the following accounts to use Cisco SID:
-
Cisco.com account: This account lets Cisco know who you are and grants you access to create service requests, download Cisco software, and access product documentation.
-
Cisco SID account: This account gives you access to the Cisco SID application.
Procedure
-
Sign up for a Cisco.com account:
-
Got to https://identity.cisco.com/ui/tenants/global/v1.0/enrollment-ui.
If the link does not open automatically or displays an error when you open it, we recommend that you copy the link and then paste it in a browser to access the link. -
Complete the online form.
-
-
Set up a Smart Account and Virtual Account or request access to an existing Smart Account and Virtual Account.
To use Cisco SID, your user account must have access to the Virtual Account Administrator role. -
Go to the Cisco Software Central page https://software.cisco.com.
-
Under Administration, click Get a Smart Account or Request Access to an Existing Smart Account, and follow the steps.
-
Create a Virtual Account within your Smart Account.
-
-
Create a Cisco SID account:
-
Go to the Cisco SID application page https://csid.cisco.com.
-
Click Create New Account and log in using your Cisco.com account.
-
Provide a name for the new account and click Next.
-
Select a Smart Account and Virtual Account to associate with your Cisco SID account.
-
Review and accept the agreements.
-
Click Create Account.
-
Logging In to Cisco SID
| If you are a CEC user, click the Log In With CEC option on the Cisco SID Analysis login page to view the reports that are shared by the Cisco SID Analysis administrator. |
Use this procedure to log into Cisco SID using your Cisco.com account ID.
Before you Begin
Ensure that you have a Cisco.com account. For information on creating an account, see Setting Up Your Accounts.
Procedure
-
Log in to Cisco SID:
-
Go to https://csid.cisco.com.
-
Click Log in With Cisco.
-
Enter your username or email and your password.
-
-
At the Choose an account prompt, select the account that you want to log in with.
-
Depending on whether you have devices in your Cisco Smart Account, perform one of the following actions:
-
If you have devices in your Cisco Smart Account, Cisco SID prompts you to add devices by synchronizing with your Smart Account. Click Select Devices > Add Devices.
-
If you do not have devices in your Cisco Smart Account, click Do this later and add devices at a later time.
-
Logging Out of Cisco SID
Use this procedure to log out of Cisco SID.
Procedure
Click the menu icon  > Sign Out.
Overview of the GUI
Before You Begin
Ensure that you have a Cisco.com account and have logged into your account. For more information, see Logging In to Cisco SID.
Overview
The Cisco SID Analysis GUI is a browser-based graphical user interface that displays the health of your fabric and the switches in your fabric.
The GUI is divided into the following sections:
-
Menu panel: Allows you to manage user access and roles. You can add team members and assign roles to the members. Click the menu icon
> System > User Management to add members and assign roles. For more information, see Managing User Roles. -
Navigation panel: Allows you to navigate between dashboards. Depending on the dashboard you are viewing, use the back button
 to navigate back to the My Reports or Fabric Overview dashboard. The Inventory dashboard includes a mini navigation panel to navigate between different inventory sections.
 -
Dashboard section: Displays information about a specific dashboard. Some of the information in the dashboard is displayed in a tabular format. Use the Filter table option to search for specific information in a table. You can also sort the information by one of the columns in descending or ascending order by clicking the table header values. Status of some of the fields in the dashboard are represented as horizontal bars. Point to the status for more information about the fields.
-
Help section: Allows you to access the help documentation
 .
.
Cisco SID Analysis GUI Status Indicators
The following table provides descriptions of the Cisco SID Analysis GUI status indicators.
| The alerts that are displayed in the report are not the realtime alerts. They were the alerts that were present in the fabric when the report was generated. |
| Status Icon | Description |
|---|---|
|
Indicates that the device is functioning properly or online. |
|
Indicates that the device has warnings. |
|
Indicates that the device has errors or offline. |
|
Indicates that there is an error such as a missing license, no light, and so on. |
|
Indicates that there are no modules or the modules are out of synchronization. |
|
(VSANs Only) Indicates that the VSAN is segmented. Click the arrow next to the VSAN ID to see the information about the VSAN segments. |
|
Indicates that the device is offline. |
|
Indicates that the device has critical alerts. |
|
Indicates that the device has error alerts. |
|
Indicates that the device has warning alerts. |
|
Indicates that the device has informational alerts. |
|
Indicates that the device has debug alerts. |


Managing User Roles
About User Roles
Team member accounts are assigned user roles that define the actions that can be performed and the scope of data that can be viewed on Cisco SID.
Cisco SID has the following user roles:
-
Account Admin: Users with this role have full access to all the Cisco SID features. There can be multiple users with the Account Admin role. The first account that is created in Cisco SID is assigned the Account Admin role.
Users with this role can do the following:
-
Create other user profiles and various roles, including those with the Account Admin role.
-
Edit system settings.
-
Edit and monitor network functions.
-
Access multiple sites.
-
Invite team members to join the Cisco SID account.
-
Delete team members from the Cisco SID account.
For security reasons, passwords are not displayed to any user, not even those with the Account Admin role.
-
-
Network Admin: Users with this role can upload, view, and delete reports. However, they will not be able to add or invite users.
-
Observer: Users with this role can only view the reports and cannot upload or delete reports.
Managing Users
For user accounts with the Account Admin role, you can invite, edit, or delete the team members from your Cisco SID account.
Before you Begin
You need to have a user account that is assigned the Account Admin role to manage users.
Procedure
-
Click the menu icon
> System > User Management. -
On the User Management page, you can do the following:
-
View the information about users in your Cisco SID account such as the email address of the user, username, role assigned to the user, last time the user logged into the account, and the status of the user account.
-
Click Add to invite users to join your Cisco SID account.
-
Click the pencil icon in the Edit column for a user to edit that account settings for the user.
-
Click the pencil icon in the Edit column for a user and then click Delete User to remove the user from your Cisco SID account.
-
My Reports
My Reports Dashboard
The My Reports dashboard allows you to upload collection zip files that were generated using Cisco SID Collector, search reports, view reports, download reports, delete reports, and so on.
The My Reports dashboard displays the following options:
-
Upload Collection: Allows you to upload the collection zip file that was generated using Cisco SID Collector. Click the Upload Collection option to navigate to the folder that includes the zip file to upload the collection zip file.
-
Search: Allows you to search for the uploaded fabric reports. As you start typing the letters of the fabric name, the fabric names of the reports that match the letters start to filter.
-
Report Card: Allows you to view the uploaded reports and displays a brief information about a fabric, such as fabric name, timestamp, fabric health score, number of critical errors, number of switches, number of end devices, and collector version. If there are critical alerts in a fabric, click Critical Alerts to navigate directly to the Fabric Alerts dashboard.
You can perform the following actions from the report card:-
Click a report to display the detailed health information of the fabric.
-
Click the download icon
 to download the report in the Microsoft Excel format.
 -
Click the delete icon
 to delete the report.
-
Overview
Overview Dashboard
The Overview dashboard displays an overview of the SAN health information of your fabric and switch.
Fabric Overview Dashboard
The Fabric Overview dashboard displays an overview of the overall fabric health.
The Fabric Overview dashboard displays the following options:
-
Fabric Score: Displays the score of your fabric. This score is the average score of all the switch scores in the fabric. The maximum score that is assigned to a fabric is 100.
-
Switches in score range: Displays the number of switches that are in different score ranges. For information on calculating switch health, see Calculating Switch Health.
The following represents different score ranges:-
Red: Represents the number of switches that are in the score range of 0 to 50.
-
Amber: Represents the number of switches that are in the score range of 51 to 75.
-
Green: Represents the number of switches that are in the score range of 76 to 100.
-
-
-
Fabric Alerts: Displays the total number of alerts in your fabric. Click the Fabric Alerts card to view the detailed information of the alerts.
The following represents the different types of fabric alerts:-
Critical: Displays the number of critical alerts.
-
Error: Displays the number of error alerts.
-
Warning: Displays the number of warning alerts.
-
Info: Displays the number of informational alerts.
-
-
End of Service/Life Alerts: Displays the number of devices that are end of service or end of life. Click the End of Service/Life Alerts card to view the detailed information about the end-of-service or end-of-life announcement alerts.
The following represents the different types of end of service or end of life announcement alerts:-
Firmware: Displays the number of firmware that are end of service or end of life.
-
Module: Displays the number of modules that are end of service or end of life.
-
Switch: Displays the number of switches that are end of service or end of life.
-
-
Devices: Displays the number of devices, including Cisco N-Port Virtualizer (Cisco NPV) switches, in your fabric. Click the Devices card to view the detailed information about the devices.
The following represents the different types of devices in your fabric:-
Switches: Displays the number of switches, including Cisco NPV switches, that are in your fabric.
-
End Devices: Displays the number of end devices that are in your fabric.
-
-
Rx/Tx Utilization: Displays the number of ports that are in use and operational in various transmit and receive percentage ranges in your fabric. Point to the bar to the display the number of ports that are being utilized in a particular range. The percentages are calculated based on the Rx and Tx counter information that is collected and the operational speed of the ports.
For port channels, the percentages are calculated by aggregating the maximum throughput of all the physical ports that are members of the port channel.
For FCIP interfaces, the percentages are calculated based on the maximum throughput that is configured on the FCIP interfaces.Cisco SID does not display utilization information for FCoE ports. Instead, it displays the utilization for the port’s binding physical interface when the interface is up and operational. -
Switches: Displays a brief information about the switches, including Cisco NPV switches, that are in your fabric.
The following information is displayed for each switch:-
Switch Name: Displays the name of the switch. You can click the switch name to check the information about the switch. For more information, see Switch Overview Dashboard.
If the name of the switch is not configured, the switch IP address will be displayed instead of the switch name. -
Port Usage (%): Displays the number of ports that are in use in the switch, in percentage. Point to the bar to display the percentage of ports that are in use.
-
EOS Alerts: Displays the number of devices that are end of service in the switch.
-
EOL Alerts: Displays the number of devices that are end of life in the switch.
-
Health Score: Displays the health score of the switch. Click the health score to display the information on how the score is calculated for the switch. For information on calculating switch health, see Calculating Switch Health.
-
Status: Displays the status of the switch. For information on status indicators, see Cisco SID Analysis GUI Status Indicators.
-
Switch Overview Dashboard
The Switch Overview dashboard displays an overview of the overall health of the switches in your fabric.
The Switch Overview dashboard displays the following options:
-
Switch Info: Displays a brief information about the switch.
The following information is displayed for the switch:-
ALIAS: Displays the switch name that is configured on the switch.
-
VERSION: Displays the operating system version running on the switch.
-
#PORTS: Displays the number of ports on the switch.
-
SWITCH STATUS: Displays the status of the switch.
The following represents some of the status for the switch:-
HEALTHY or ok: Indicates that the switch is functioning properly.
-
Module Warning: Indicates that the module, power supply, or fan that are connected to the switch have issues. Check the status of the module, power supply, or fan for more information.
-
Cannot Connect: Indicates that the switch is unreachable.
-
-
SWITCH HEALTH: Displays the health of the switch. Click the switch score to display the information on how the score is calculated for the switch. For information on calculating switch health, see Calculating Switch Health.
-
POWER USAGE: Displays the amount of power that is being used by switch, in Watts.
-
VENDOR: Displays the vendor name of the switch.
-
MODEL: Displays the model of the switch.
-
SERIAL NUMBER: Displays the serial number of the switch.
-
NPV/AG: Displays True if the switch is operating in the Cisco NPV mode or Brocade Access Gateway mode, or False if the switch is operating in the switch mode.
-
-
Alerts: Displays the total number of alerts on the switch.
The following represents the different types of switch alerts:-
Critical: Displays the number of critical alerts.
-
Error: Displays the number of error alerts.
-
Warning: Displays the number of warning alerts.
-
Info: Displays the number of informational alerts.
-
-
End of Service/Life Alerts: Displays the number of devices that are end of service or end of life. Click the End of Service/Life Alerts card to view the detailed information about the end-of-service or end-of-life announcement alerts.
The following represents the different types of end of service or end of life announcement alerts:-
Firmware: Displays the number of firmware that are end of service or end of life.
-
Module: Displays the number of modules that are end of service or end of life.
-
Switch: Displays the number of devices that are end of service or end of life.
-
-
End Devices: Displays the number of end devices that are connected to the switch.
-
Port Consumption: Displays the number and percentage of ports that are in use and operational in the switch.
The following information is displayed:Ports In Use: Displays the number of ports that are in use and operational. Point to the bar to display the percentage of ports that are in use and operational.
-
Modules: Displays information about the modules that are available on the switch.
The following information is provided for each module:-
Model: Displays the model of the module.
-
Description: Displays the description of the module.
-
Slot: Displays the module identifier.
-
Power Usage (W): Displays the amount of power that is being used by the module, in Watts.
-
Status: Displays the status of the module. For information on status indicators, see Cisco SID Analysis GUI Status Indicators.
-
-
Ports: Displays information about the ports that are available on the switch.
The following information is provided for each port:-
Port: Displays the name of the port.
-
Operating Speed: Displays the operating speed of the port.
-
Max Speed: Displays the maximum speed of the port.
-
Status: Displays the status of the port. For information on status indicators, see Cisco SID Analysis GUI Status Indicators.
-
Calculating Switch Health
Switch health is calculated based on the following parameters:
-
Total number of modules in the switch (x)
-
Total number of modules that have warning alerts (excluding the modules that have status as functioning properly, active, or ha-standby for Cisco switches and enabled or vacant for Brocade switches) in the switch (x1)
-
Total number of ports on the switch (y)
-
Total number of ports that are physically connected and have warning alerts (excluding ports that have status as administratively down) on the switch (y1)
-
Total number of alerts with severity warning and above (z). If the total number of alerts with severity warning and above is greater than or equal to 1000, then the score for this component is considered to be 0. If the total number of alerts with severity warning and above is lesser than 1000, then the score for this component (z) is considered to be (1000 - z).
The following equations are used to calculate the switch health:
-
When the total number of alerts with severity warning and above is greater than or equal to 1000: (((x - x1) / x) * 0.4) + (((y - y1) / y) * 0.3)
-
When the total number of alerts with severity warning and above is lesser than 1000: (((x - x1) / x) * 0.4) + (((y - y1) / y) * 0.3) + ((1000 - z) / 1000) * 0.3)
| The values 0.4, 0.3, and 0.3 in the above equations are the ratio weights assigned to module, port, and alert scores respectively. |
Example: Calculating Switch Health
Let us consider a switch that has the following parameters:
-
Total number of modules (x): 10
-
Total number of modules that have warning alerts (x1): 1
-
Total number of ports (y): 100
-
Total number of ports that have warning alerts (y1): 5
-
Total number of alerts with severity warning and above alerts (z): 200
Switch health is calculated as follows:
-
Module score: ((10 - 1) / 10) * 0.4 = 0.36
-
Port score: ((100 - 5) / 100) * 0.3 = 0.285
-
Alerts score: ((1000 - 200) / 1000) * 0.3 = 0.24
-
Switch health score: 0.36 (module score) + 0.29 (port score) + 0.24 (alerts score) = 0.885. This score in percentage is 88%.
Alerts
Alerts Dashboard
The Alerts dashboard displays information about the alerts in your fabric or switch.
| The alerts that are displayed in the report are not the realtime alerts. They were the alerts that were present in the fabric when the report was generated. |
Fabric Alerts Dashboard
The Fabric Alerts dashboard displays information of all the alerts in a fabric. The top four alerts are displayed as cards next to the Total Alerts card. Click a card to filter the alerts specific to the card.
The Fabric Alerts dashboard displays the following options:
|
The following represents the different types of switch alerts: Critical: Displays the number of critical alerts. Error: Displays the number of error alerts. Warning: Displays the number of warning alerts. Info: Displays the number of informational alerts. |
-
Total Alerts: Displays the total number of alerts in the fabric.
-
Alerts: Displays detailed information about the alerts in the fabric.
The following information is provided for each switch:-
Switch Name: Displays the name of the switch. You can click the switch name to check the information about the switch. For more information, see Switch Overview Dashboard.
If the name of the switch is not configured, the switch IP address will be displayed instead of the switch name. -
Alert Source: Displays the name of the device or application on the switch that has an alert. The alert source can be a hardware or software component.
-
Alert Source ID: Displays the slot number for hardware components and component identifier for software components.
-
Severity: Displays the severity of the alert. For debug alerts, the severity is set to Debug. For information on status indicators, see Cisco SID Analysis GUI Status Indicators.
-
Description: Displays the description of the alert.
-
Time: Displays the timestamp of the alert.
-
Switch Alerts Dashboard
The Switch Alerts dashboard displays information of all the alerts on a switch. The top four alerts are displayed as cards next to the Total Alerts card. Click a card to filter the alerts specific to the card.
The Switch Alerts dashboard displays the following options:
|
The following represents the different types of switch alerts: Critical: Displays the number of critical alerts. Error: Displays the number of error alerts. Warning: Displays the number of warning alerts. Info: Displays the number of informational alerts. |
-
Total Alerts: Displays the total number of alerts on the switch.
-
Alerts: Displays detailed information about the alerts on the switch.
The following information is provided for each device:-
Alert Source: Displays the name of the device or application on the switch that has an alert. The alert source can be a hardware or software component.
-
Alert Source ID: Displays the slot number for hardware components and component identifier for software components.
-
Severity: Displays the severity of the alert. For debug alerts, the severity is set to Debug. For information on status indicators, see Cisco SID Analysis GUI Status Indicators.
-
Description: Displays the description of the alert.
-
Time: Displays the timestamp of the alert.
-
Inventory
Inventory Dashboard
The Inventory dashboard displays information about the inventory of the fabric or switch.
Inventory dashboard displays the following types of inventory:
-
Fabric Inventory: Displays inventory of Switch, Modules, Licenses, Devices, and EOS/EOL in the fabric.
-
Switch Inventory: Displays inventory of Ports, Modules, Licenses, Devices, and EOS/EOL for a switch in the fabric.
Fabric Inventory Dashboard
Switch Dashboard
| The Switch dashboard is available only in the Fabric Inventory view. |
The Switch dashboard displays information of all the switches in the fabric.
The Switch dashboard displays the following options:
-
Switches with Critical Scores: Displays the number of switches that have scores less than 50.
-
Switches: Displays the number of switches, including Cisco NPV switches, that are connected to the fabric.
-
Total Power Used: Displays the total power that is used by the switches in the fabric.
-
Switches: Displays detailed information of all the switches in the fabric.
The following information is provided for each switch:-
Switch Name: Displays the name of the switch. You can click the switch name to check the information about the switch. For more information, see Switch Overview Dashboard.
If the name of the switch is not configured, the switch IP address will be displayed instead of the switch name. -
Worldwide Name: Displays the world wide name (WWN) of the switch.
-
Vendor: Displays the vendor name of the switch.
-
Model: Displays the model of the switch.
-
Version: Displays the software version that the switch is running.
-
Power(W): Displays the power usage of the switch, in Watts.
-
Devices: Displays the number of end devices that are connected to the switch.
-
ISLs: Displays the number of ISLs, including Cisco NPV links, that are configured on the switch.
-
Days Up: Displays how long the switch is up and running, in days.
-
Health Score: Displays the health score of the switch. Click the health score to display the information on how the score is calculated for the switch. For information on calculating switch health, see Calculating Switch Health.
-
Status: Displays the status of the switch. For information on status indicators, see Cisco SID Analysis GUI Status Indicators.
-
NPV/AG: Displays if the switch is operating in the Cisco NPV mode or Brocade Access Gateway mode.
-
Modules Dashboard
The Modules dashboard displays information of all the modules that are in the fabric or switch.
The Modules dashboard displays the following options:
-
Modules: Displays the total number of modules, supervisors, and crossbars in the fabric or switch.
-
Line Cards: Displays the total number of IO modules in the fabric or switch.
-
Supervisors: Displays the total number of supervisors in the fabric or switch.
-
XBars: Displays the total number of crossbars in the fabric or switch.
-
Total Power Used: Displays the total power that is used by the modules, supervisors, and crossbars in the fabric or switch, in Watts.
-
Modules: Displays detailed information of the modules in the fabric or switch.
The following information is provided for each fabric or switch:-
Switch Name (Fabric Inventory view only): Displays the name of the switch. You can click the switch name to check the information about the switch. For more information, see Switch Overview Dashboard.
If the name of the switch is not configured, the switch IP address will be displayed instead of the switch name. -
Description: Displays the description of the module.
-
Slot: Displays the slot identifier.
-
Serial Number: Displays the serial number of the switch or module.
-
Model: Displays the model of the switch or module.
-
Power(W): Displays the amount of power that is used by the switch or module, in Watts.
-
Days Up: Displays how long the switch or module is up and running, in days.
-
Status: Displays the status of the switch or module. For information on the status indicators, see Cisco SID Analysis GUI Status Indicators.
-
Licenses Dashboard
The Licenses dashboard displays information of licenses that are used in the fabric or switch.
The Licenses dashboard displays the following options:
-
Licenses in need of attention: Displays the total number of licenses, including the honor and missing licenses, that are in grace period in the fabric or switch. You can sort the Comments column in the Licenses table to view the details.
-
Total Licenses: Displays the total number of licenses that are available in the fabric or switch.
-
Total Installed: Displays the total number of licenses that are installed in the fabric or switch. This count includes all Cisco and Brocade licenses that have the Install state as YES or CLI.
-
Total In Use: Displays the total number of licenses that are in use in the fabric or switch. This count includes only the Cisco licenses that have the InUse status as YES or CLI.
-
Licenses: Displays detailed information of licenses that are available in the fabric or switch.
The following information is provided for each license:-
Switch Name (Fabric Inventory view only): Displays the name of the switch. You can click the switch name to check the information about the switch. For more information, see Switch Overview Dashboard.
If the name of the switch is not configured, the switch IP address will be displayed instead of the switch name. -
License: Displays the name of the license.
-
Expiration Date: Displays the date of expiry of the license.
-
License Count: Displays the number of licenses that are available for use.
-
Comments: Displays the status of the license such as the grace period, honor license, missing license, and so on.
-
Installed: Displays the status of the license installation. For information on the status indicators, see Cisco SID Analysis GUI Status Indicators.
-
Use Status: Displays the status of the license. For information on the status indicators, see Cisco SID Analysis GUI Status Indicators.
-
Devices Dashboard
The Devices dashboard displays information of all the end devices that are connected in the fabric.
The Devices dashboard displays the following options:
-
Connected Devices: Displays the total number of devices that are connected in the fabric.
-
Devices: Displays detailed information of devices that are connected in the fabric.
The following information is provided for each end device:-
Endpoint Name: Displays the endpoint name (fcalias or device-alias) that is configured on the end device.
-
PWWN: Displays the port world wide name (pWWN) of the end device.
-
FCID: Displays the Fibre Channel ID (FCID) of the end device.
-
Endpoint Vendor: Displays the vendor name of the end device.
-
Connected Switch: Displays the name of the switch to which the end device is connected.
If the name of the switch is not configured, the switch IP address will be displayed instead of the switch name. -
Connected Interface: Displays the interface to which the end device is connected.
-
FC4Type: Displays the FC4Type feature information for the end device.
-
Symbolic Node Name: Displays the HBA symbolic node-name.
-
VSAN ID: Displays the VSAN ID that is configured on the end device. This information is available only when the end device is connected to a Cisco switch that has VSAN information.
-
EOS/EOL Dashboard
| The EOS/EOL dashboard is available only for reports that are collected using the Cisco SID Collector version 2.0 or later. |
The EOS/EOL dashboard displays information about the end-of-support (EOS) or end-of-life (EOL) announcement alerts.
The EOS/EOL dashboard displays the following options:
-
Total Alerts: Displays the total number of EOS and EOL announcement alerts in the fabric. The top four alerts are displayed as cards next to the Total Alerts card. Click a card to filter the alerts specific to the card.
-
EOS/EOL Alerts: Displays detailed information of all EOS and EOL announcement alerts for the fabric.
The following information is provided for the fabric:-
Switch Name: Displays the name of the switch. You can click the switch name to check the information about the switch. For more information, see Switch Overview Dashboard.
If the name of the switch is not configured, the switch IP address will be displayed instead of the switch name. -
Type: Displays the type of alert.
-
Product: Displays the product identifier.
-
Slot: Displays the slot number of the product.
-
EOS/EOL Firmware: Displays the software version that is installed on the product.
-
EOS/EOL Date: Displays the date when the alert was generated.
-
Switch Inventory Dashboard
Ports Dashboard
| The Ports dashboard is available only in the Switch Inventory view. |
The Ports dashboard displays information of all the ports that are available on a switch.
The Ports dashboard displays the following options:
-
Total Ports: Displays the total number of ports that are available on the switch.
-
Port Consumption: Displays the number and percentage of ports that are in use and operational in the switch.
The following information is displayed:Ports In Use: Displays the number of ports that are in use and operational. Point to the bar to display the percentage of ports that are in use and operational.
-
Ports: Displays detailed information of ports that are available on the switch.
The following information is provided for each port:-
Port: Displays the port identifier.
-
Operating Mode: Displays the operating mode of the port.
-
Admin Mode: Displays the administrative mode of the port.
-
Operating Speed: Displays the operating speed of the port.
-
Connected To: Displays the peer information for the port that is in the operational mode.
-
Max Speed: Displays the maximum speed that is supported by the port.
-
Transceiver: Displays information about transceiver.
-
Status: Displays the status of the port. For information on status indicators, see Cisco SID Analysis GUI Status Indicators.
-
Modules Dashboard
The Modules dashboard displays information of all the modules that are on the switch.
The Modules dashboard displays the following options:
-
Modules: Displays the total number of modules, supervisors, and crossbars on the switch.
-
Line Cards: Displays the total number of IO modules on the switch.
-
Supervisors: Displays the total number of supervisors on the switch.
-
XBars: Displays the total number of crossbars on the switch.
-
Total Power Used: Displays the total power that is used by the modules, supervisors, and crossbars on the switch, in Watts.
-
Modules: Displays detailed information of the modules on the switch.
The following information is provided for the switch:-
Model: Displays the model of the switch or module.
-
Description: Displays the description of the module.
-
Slot: Displays the slot identifier.
-
Serial Number: Displays the serial number of the switch or module.
-
Power(W): Displays the amount of power that is used by the switch or module, in Watts.
-
Days Up: Displays how long the switch or module is up and running, in days.
-
Status: Displays the status of the switch or module. For information on the status indicators, see Cisco SID Analysis GUI Status Indicators.
-
Licenses Dashboard
The Licenses dashboard displays information of licenses that are used in the switch.
The Licenses dashboard displays the following options:
-
Licenses in need of attention: Displays the total number of licenses, including the honor and missing licenses, that are in grace period in the switch. You can sort the Comments column in the Licenses table to view the details.
-
Total Licenses: Displays the total number of licenses that are available on the switch.
-
Total Installed: Displays the total number of licenses that are installed on the switch. This count includes all Cisco and Brocade licenses that have the Install state as YES or CLI.
-
Total In Use: Displays the total number of licenses that are in use on the switch. This count includes only the Cisco licenses that have the InUse status as YES or CLI.
-
Licenses: Displays detailed information of licenses that are available in the fabric or switch.
The following information is provided for each license:-
License: Displays the name of the license.
-
Expiration Date: Displays the date of expiry of the license.
-
License Count: Displays the number of licenses that are available for use.
-
Comments: Displays the status of the license such as the grace period, honor license, missing license, and so on.
-
Installed: Displays the status of the license installation. For information on the status indicators, see Cisco SID Analysis GUI Status Indicators.
-
Use Status: Displays the status of the license. For information on the status indicators, see Cisco SID Analysis GUI Status Indicators.
-
Devices Dashboard
The Devices dashboard displays information of all the end devices that are connected to the switch.
The Devices dashboard displays the following options:
-
Connected Devices: Displays the total number of devices that are connected to the switch.
-
Devices: Displays detailed information of devices that are connected to the switch.
The following information is provided for each end device:-
Endpoint Name: Displays the endpoint name (fcalias or device-alias) that is configured on the end device.
-
PWWN: Displays the port world wide name (pWWN) of the end device.
-
FCID: Displays the Fibre Channel ID (FCID) of the end device.
-
Endpoint Vendor: Displays the vendor name of the end device.
-
Connected Switch: Displays the name of the switch to which the end device is connected.
If the name of the switch is not configured, the switch IP address will be displayed instead of the switch name. -
Connected Interface: Displays the interface to which the end device is connected.
-
FC4Type: Displays the FC4Type feature information for the end device.
-
Symbolic Node Name: Displays the HBA symbolic node-name.
-
VSAN ID: Displays the VSAN ID that is configured on the end device. This information is available only when the end device is connected to a Cisco switch that has VSAN information.
-
EOS/EOL Dashboard
| The EOS/EOL dashboard is available only for reports that are collected using the Cisco SID Collector version 2.0 or later. |
The EOS/EOL dashboard displays information about the end-of-support or end-of-life announcement alerts.
The EOS/EOL dashboard displays the following options:
-
Total Alerts: Displays the total number of EOS and EOL announcement alerts on the switch. The top four alerts are displayed as cards next to the Total Alerts card. Click a card to filter the alerts specific to the card.
-
EOS/EOL Alerts: Displays detailed information of all EOS and EOL announcement alerts for the switch.
The following information is provided for the switch:-
Type: Displays the type of alert.
-
Product: Displays the product identifier.
-
Slot: Displays the slot number of the product.
-
EOS/EOL Firmware: Displays the software version that is installed on the product.
-
EOS/EOL Date: Displays the date when the alert was generated.
-
VSAN
VSANs Dashboard
The Fabric VSANs dashboard displays information about the VSANs that are configured in the fabric.
| Cisco SID does not collect information for suspended VSANs. |
The Fabric VSANs dashboard displays the following options:
-
Total VSANs: Displays the total number of VSANs that are configured in the fabric.
-
VSANs Down: Displays the total number of VSANs whose operational status is down.
-
VSANs Segmented: Displays the total number of VSANs that are segmented.
-
VSANs Up: Displays the total number of VSANs whose operational status is up.
-
VSANs: Displays detailed information of the VSANs that are configured in the fabric.
The following information is provided for each VSAN:-
ID: Displays the VSAN identifier. When there are multiple segments in a VSAN, the segments are grouped under the same VSAN ID. Click the arrow next to the VSAN ID to see the information about the VSAN segments.
-
VSAN Name: Displays the name of the VSAN.
-
Principle Switch: Displays the name of the principle switch.
-
Active Zoneset: Displays the name of the active zoneset.
-
IE-WWN: Displays the interconnect element (IE) WWN ID.
-
Switches: Displays the number of switches, including Cisco NPV switches, that are configured in the VSAN.
-
Status: Displays the status for VSANs. For information on the status indicators, see Cisco SID Analysis GUI Status Indicators.
-
-
Active Zoneset Members: Displays the zoneset members of a VSAN when the VSAN is selected.
The following information is provided for each active zoneset member:-
Members in active zoneset: Displays the total number of active zoneset members.
-
Zone Name: Displays the zone name.
-
Alias: Displays the alias name.
-
Member Type: Displays the zone member type.
-
Zone Member: Displays zone member.
-
Logged In: Displays the status of the zone member login. For information on the status indicators, see Cisco SID Analysis GUI Status Indicators.
-
Zones
Zones Dashboard
| The Zones dashboard is available only when there are Brocade switches that are not operating in the Access Gateway mode in the fabric. |
The Zones dashboard displays information about the zones that are configured on Brocade switches in your fabric.
The Zones dashboard displays the following options:
-
Zoneset Name: Displays the name of the zoneset.
-
Zones in Zoneset: Displays the number of zones in the zoneset.
-
Total Members: Displays the total number of members in the zoneset.
-
Active Zoneset Members: Displays the zoneset members of a VSAN when a VSAN is selected. The following information is provided for each active zoneset member:
-
Zone Name: Displays the zone name.
-
Alias: Displays the alias name.
-
Zone Member Type: Displays the zone member type.
-
Zone Member: Displays the zone member ID.
-
Logged In: Displays the status of the zone member login. For information on the status indicators, see Cisco SID Analysis GUI Status Indicators.
-
Utilization
Utilization Dashboard
The Fabric Utilization and Switch Utilization dashboards display information about the port consumption, CPU usage, and memory utilization in the fabric.
| From Cisco SID Release 2.0(1), the utilization information is available for switches. The information that is displayed under the Switch Utilization dashboard is similar to the information that is displayed under the Fabric Utilization dashboard, except that the information under the Switch Utilization dashboard is specific to a switch. |
The Fabric Utilization dashboard displays the following options:
-
Port Consumption: Displays the number and percentage of ports that are in use and operational in the fabric.
The following information is displayed:Ports In Use: Displays the total number of ports that are in use and operational.
-
Port Usage By Capacity: Displays the number of ports that are in use and operational under different port-speed category. Point to the bar to display the percentage of ports that are under each category.
-
Rx/Tx Utilization: Displays the number of ports that are in use and operational in various transmit and receive percentage ranges in your fabric. Point to the bar to the display the number of ports that are being utilized in a particular range. The percentages are calculated based on the Rx and Tx counters information that is collected and the operational speed of the ports.
For FCIP interfaces, the percentages are calculated based on the maximum throughput that is configured on the FCIP interfaces.Cisco SID does not display utilization information for FCoE ports. Instead, it displays the utilization for the port’s binding physical interface when the interface is up and operational. -
Port Utilization: Displays detailed information about port utilization.
The following information is provided for each switch:-
Switch Name: Displays the name of the switch. You can click the switch name to check the information about the switch. For more information, see Switch Overview Dashboard.
If the name of the switch is not configured, the switch IP address will be displayed instead of the switch name. -
Port: Displays the name of the port. If a port is bound to a virtual Fibre Channel (vFC) interface, the vFC name will also be displayed in addition to the name of the port.
-
Mode: Displays the mode in which the port is operating.
-
Speed: Displays the operational speed for Fibre Channel and Ethernet physical interfaces.
For port channel, SAN port channel, and Ethernet port channel, the speed displayed is the aggregated operational speed of the member physical interfaces.
For FCIP interfaces, the speed displayed is the aggregated maximum throughput of the FCIP interface.
For FCIP port channel, the speed displayed is the aggregated maximum throughput of the member FCIP interfaces. -
PortChannel or FCIP: Displays if the port is part of a port channel or Fibre Channel over IP (FCIP).
Cisco SID does not display utilization information for FCoE ports. Instead, it displays the utilization for the port’s binding physical interface when the interface is up and operational. -
Rx Util: Displays the receive utilization for the port.
-
Tx Util: Displays the transmit utilization for the port.
-
-
Switch CPU and Memory Utilization: Displays detailed information about the CPU and memory that is utilized by each switch.
The following information is provided for each switch:-
Switch Name: Displays the name of the switch. You can click the switch name to check the information about the switch. For more information, see Switch Overview Dashboard.
If the name of the switch is not configured, the switch IP address will be displayed instead of the switch name. -
Mem. Status: Displays the status of the memory of the switch. For information on the status indicators, see Cisco SID Analysis GUI Status Indicators.
-
Mem. Usage: Displays the memory usage status of the switch. Point to the bar to display the percentage of memory that is utilized by the switch.
-
CPU Usage: Displays the CPU utilization status of the switch. Point to the bar to display the percentage of CPU that is utilized by the switch.
-
Topology
Topology Dashboard
The Topology dashboard displays nodes and links that correspond to various network elements such as switches, hosts, storages, and links. The switch icons are colored based on the health score of the switch. For example, if a switch score is 97, the color of the switch icon will be green. For information about each of these elements, point the cursor to the corresponding element. Point the cursor to a link to view the interfaces that are connected to the link. If there are multiple ISLs connected between switches, multiple links will be displayed and you can view the interfaces connected to each link by pointing the cursor to the link. Click and hold an element to identify the peer devices that are connected to the element. Double-click a switch to view more information.
| Check the Show End Devices check box to display the hosts and storage devices. |
Migration
Migration Dashboard
| There are additional migration capabilities within Cisco SID that can ease the transition over to a new Cisco deployment. This information will be made available to Cisco employees and some Cisco partners. For more information about this capability, contact your local Cisco or Cisco partner representative. |
| The Migration dashboard is available only for reports that are collected using the Cisco SID Collector version 2.0 or later and only for Brocade fabrics. |
The Migration dashboard provides migration report that allows you to migrate from existing Brocade to Cisco switches.
Switch Migration
The Switch Migration dashboard provides information for migrating from Brocade to Cisco switches. If you want to download the switch migration report, click Download.
The Switch Migration dashboard displays the following options:
-
Switch Name: Displays the name of the Brocade switch. You can click the switch name to check the switch health. For more information, see Switch Overview Dashboard.
If the name of the switch is not configured, the switch IP address will be displayed instead of the switch name. -
Serial Number: Displays the serial number of the switch.
-
Brocade Switch Model: Displays the model of the switch.
-
Brocade Switch Speed: Displays the maximum speed supported by the switch.
-
Brocade Licensed Port: Displays the number of port licenses that are in use.
-
Brocade Total Ports: Displays the total number of ports on the switch.
-
Supported Cisco Switch: Displays the Cisco switch model that can replace the Brocade switch.
-
Cisco Config Options: Displays the various configuration options available to migrate from Brocade to Cisco switches.
Zoning Migration
The Zoning Migration dashboard allows you to configure and download the zoning migration information for migrating from Brocade to Cisco switches.
To configure and download the zoning migration information, perform these steps:
-
Enter a VSAN ID in the Select Target VSAN field.
-
(Optional) Check the Enhanced Zoning check box to include the enhanced zoning configuration information.
-
(Optional) Check the Enhanced Device Alias check box to include the enhanced device alias configuration information.
-
Click Submit to generate the zoning migration information.
The zoning migration information is generated in the Cisco Migration pane. You can copy the information or click Download to download the information.
Switch Parameters Migration
The Switch Parameters Migration dashboard allows you to migration other switch parameters, such as NTP, SNMP, sylog, AAA, and so on, from Brocade to Cisco switches. The migration information is generated in the Cisco Migration pane. You can copy the information or click Download to download the information.
| If you used a non-admin user credentials for generating the collection zip file for a fabric, the Switch Parameters Migration tab on Cisco SID Analysis will not show the AAA configuration migration output. |
Comparing Reports
Compare with Other Report
The Compare with other report option allows you to compare two fabric reports that were collected at different points in time to see the changes that the fabric has gone through. The report displays the changes from the Source Report perspective. Cisco SID Analysis compares the Source Report with the Select Compare Report and displays the changes. The source information is indicated in pink and the information that is being compared to is indicated in blue. The source information is displayed on the left and the information that is being compared to is displayed on the right.
Depending on the reports that are being compared, the information that is reported under the Change column may vary. For example, let us consider a scenario where you have generated a report for a fabric when some of the switches and modules were down or missing and then generated another report when the switches and modules have come up. When you compare the older report when the switches and modules were down or missing with the newer report when the switches and modules were up, the Change status for these switches and modules will be displayed as Added. However, when you compare the newer report with the older report, the status for these switches and modules will be displayed as Removed.
The Comparison dashboard displays the changes in detail. For more information, see Comparison Overview.
| You can only compare reports that are collected using the Cisco SID Collector version 2.0 or later. This condition applies to both the source report and the report that is being compared to. |
| An error is displayed when you try to compare reports from different fabrics. |
| For comparing two reports, at least one switch must be the same in both the reports. |
Comparing Reports
Use this procedure to compare two reports of the same fabric.
Procedure
-
Log in to Cisco SID. For information on logging in to Cisco SID, see Logging In to Cisco SID.
-
On the My Reports dashboard, click the source report that you want to compare.
-
From the Fabric Overview dashboard, click the Compare with other report option on the navigation panel.
-
In the Select a report to compare with window, click the report that you want to compare with and click OK.
-
(Optional) If you want to compare a different report for the same fabric, click Select Compare Report, click the report that you want to compare, and click OK.
Comparison Overview
The Comparison Overview dashboard displays a comparison of two fabric reports. The Comparison Overview dashboard displays changes for various view types. Each view type displays the changes in the form of cards, or cards and tables. The titles for some of the cards are displayed in different colors depending on if the score has gone up or down. The indicator next to the card titles indicates if the respective score has gone up, down, or is the same.
The Change column in the tables displays the status of the change from the perspective of the source report.
Cisco SID only compares fatal, critical, error, and warning alerts and their status can be either Added or Removed.
The following represents the different status in the Change column:
-
Added: This status represents that this entry is missing in the source report and only exists in the report that it is being compared to.
-
Changed: This status represents that this entry is present in both reports but there were changes in some attributes. Click the Changed status to view the list of changes. Cisco SID displays a sidebar with the details of all the changes for the entry. Each change is represented by an arrow. The data on the left-side of the arrow is from the source report and the data on the right-side is from the report that it is being compared to. If either of the data is not available, the data field may be set to "--" or left blank.
-
Removed: This status represents that this entry exists only in the source report and does not exist in the report that is being compared to.
The Comparison Overview dashboard displays the following view types:
-
Overview: Displays a comparison of two fabric reports of the same fabric. It displays a comparison of Fabric Score, Total Alerts, End of Service/Life Alerts, Devices, Total VSAN Zone Members, Total VSAN Zones, Total ISLs, Total Switches, Total Modules, Used Ports, Licenses in need of attention, and Total Licenses. For more information, see Fabric Overview Dashboard and Switch Overview Dashboard.
Cisco SID Analysis displays an error if it cannot find at least one switch that is the same in the two fabric reports. Cisco SID Analysis uses the serial number of the switch to identify the switch. -
Alerts: Displays a comparison of the fabric and switch alerts information. It displays a comparison of Total Alerts, Critical Alerts, Error Alerts, Warnings, and Info Alerts. For more information, see Fabric Alerts Dashboard and Switch Alerts Dashboard.
If there are duplicate alerts, some of them may be ignored and may not be displayed in the Alerts table. The status for alerts is shown as removed for the following reasons:
-
Actual alert information is unavailable on the switch.
-
Actual alert information is available on the switch; however, the information maybe more than 6 months old for Cisco switches and more than 15 days old for Brocade switches.
-
-
Switch: Displays a comparison of the Switch dashboard in the Fabric Inventory. It displays a comparison of Total Switches. For more information, see Switch Dashboard.
-
Modules: Displays a comparison of the Modules dashboard in the Fabric Inventory. It displays a comparison of Total Modules. For more information, see the Modules Dashboard for fabric and Modules Dashboard for switch.
The information that is displayed in the Modules table is only for the switches that exist on both the reports and not for switches that were added or removed. The Total Modules card displays the total number of modules present in each fabric. This information is same as the Total Modules information that you see on the Overview view type of the Comparison Overview dashboard. -
Ports: Displays a comparison of the Ports dashboard in the Switch Inventory. It displays a comparison of Total Ports and Used Ports. For more information, see Ports Dashboard.
The information that is displayed in the Ports table is only for the switches and modules that exist on both the reports and in the same slot, and not for switches and modules that were added or removed. However, if the source report consists of a new module, it will be displayed under the Modules tab, but not under the Ports tab. If the module is moved to a different slot, it will be displayed under the Modules tab with the slot ID changed, but not under the Ports tab. The Total Ports and Used Ports cards display the total number of ports and the number of used ports in each fabric. When a new host is connected to a switch, the Change status for the port that is connected to the host is set to Changed and this is the default behavior. However, when you click the Changed status for the port, the Connected To status in the Port panel does not display the source as "--". -
Devices: Displays a comparison of the Devices dashboard in the Switch Inventory. It displays a comparison of Total Connected Devices. For more information, see Devices Dashboard.
-
Licenses: Displays a comparison of the Licenses dashboard in the Fabric Inventory and Switch Inventory. It displays a comparison of Licenses in need of attention and Total Licenses. For more information, see the Licenses Dashboard for fabric and Licenses Dashboard for switch.
-
ISLs: Displays a comparison of ISLs. It displays a comparison of Total ISLs.
-
Zones: Displays a comparison of the Zones dashboard for Brocade switches. It displays a comparison of Total Zones and Total Zone Members. For more information, see Zones Dashboard.
-
VSANs: Displays a comparison of the VSANs dashboard. It displays a comparison of Total VSANs, VSANs Up, VSANs Segmented, and VSANs Down. For more information, see VSANs Dashboard.
When the principal switch for a VSAN is changed, the VSAN will have two entries—one entry as Removed with the older principal switch name and one as Added with the newer principal switch name. -
VSAN Zones: Displays a comparison of the VSANs zones in the VSANs dashboard. It displays a comparison of Total VSAN Zones and Total VSAN Zone Members. For more information, see VSANs Dashboard.
When the principal switch for a VSAN is changed, the VSAN zone members will have two entries—one entry as Removed with the older principal switch name and one as Added with the newer principal switch name.
The following table provides the different attributes that are used for determining the change status:
| View Type | Identifier | Parameters |
|---|---|---|
Switch |
Serial Number |
|
Modules |
|
|
Ports |
Port name slot/port |
|
Devices |
pWWN |
|
Licenses |
License feature name |
|
ISLs |
|
ISL VSAN lists where the ISL is up and if the ISL is an NPV link |
Zones |
|
Logged in status (true or false; online or offline) and alias, if any |
VSANs |
|
|
VSAN Zones |
|
Logged in status (true or false; online or offline) and alias, if any |
Troubleshooting Cisco SAN Insights Discovery
Troubleshooting Scenarios
Cisco SID Collector
A log file is created every time that you generate a report using Cisco SID Collector. If you have issues generating a report, send the log file to csid-support@cisco.com for assistance.
Cisco SID Analysis
Cisco SID Analysis displays error messages whenever there is an issue encountered by the application.
The following are some of the error messages and the possible solutions:
-
The zip file cannot be unzip: Ensure that you are uploading the zip file of the report.
-
The zip file does not contain the output files as expected: Ensure that the report was generated successfully without any errors by Cisco SID Collector.
-
Cisco SID cannot get the report id from the output JSON file: Ensure that the report was generated successfully without any errors by Cisco SID Collector and was not modified manually.
-
Bad file in general: Ensure that the report was generated successfully without any errors by Cisco SID Collector.
-
The version of the report is not compatible with the Cisco SID Analysis version: Ensure that the report was generated using the latest version of Cisco SID Collector. For more information, see Installing Cisco SID Collector on Windows.
If you encounter any other issues, send your issues to csid-support@cisco.com.